
Model and methodology
Coronavirus policy response has been fairly variable throughout the world. This article analyses the effectiveness of the different approaches emerged so far among the countries that show the highest number of reported cases.
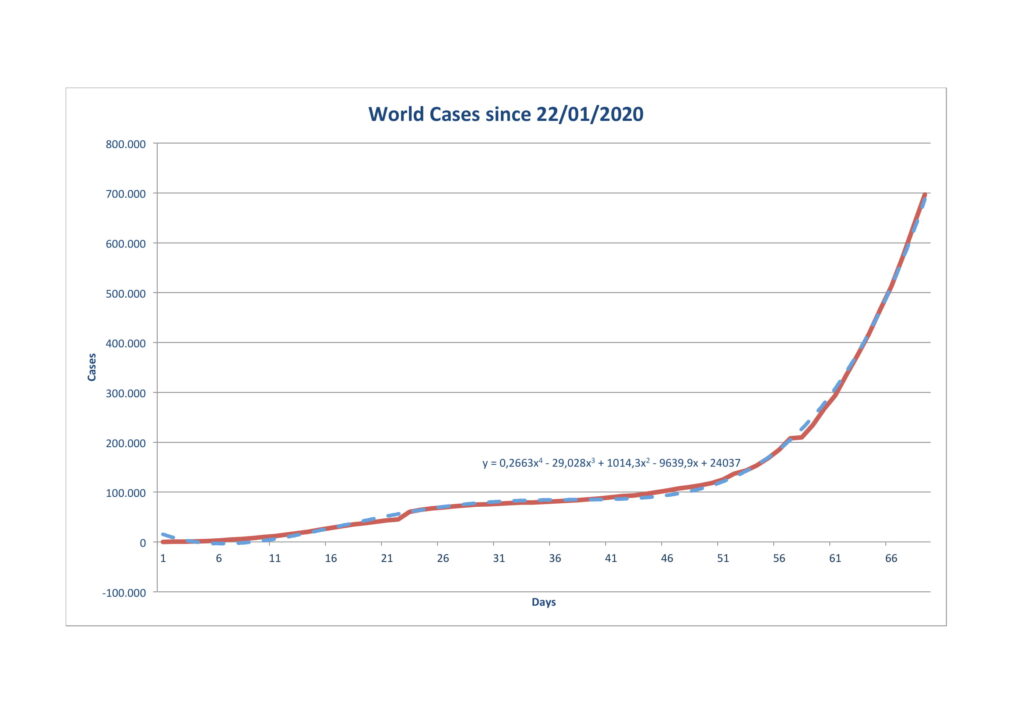
A rapid update on the Coronavirus outbreak. Please check the last update from 18.03.2020 to know more about the methodology and the numerical model developed to simulate virus development.
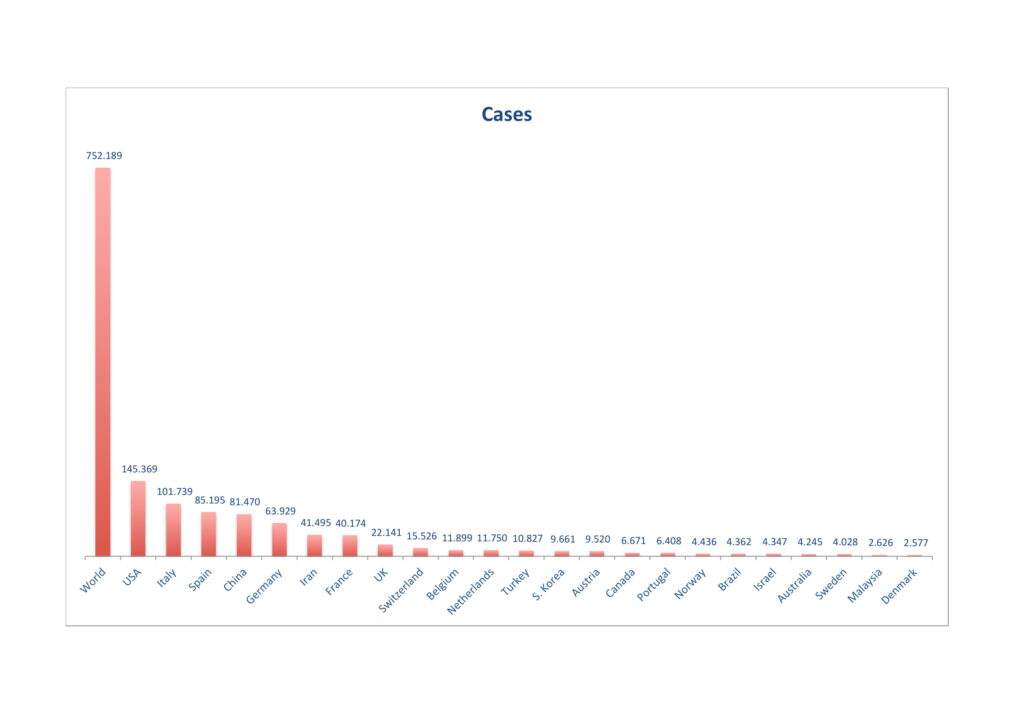
Cases – as of 30.03.2020 – have now reached over 750k, with US, Italy and Spain the hardest hit countries
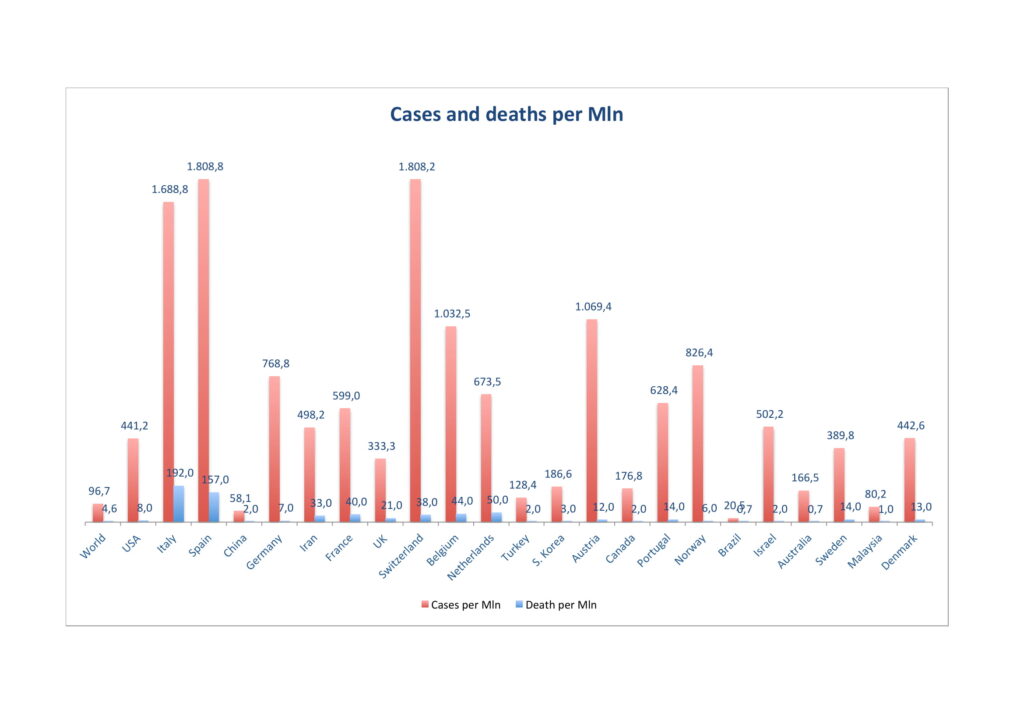
A more interesting view comes from a per mln population comparison. Behind the usual suspects, Italy and Spain, we observe more countries where the situation is becoming more critical, relevant to population size.
I’ve received different requests to compare coronavirus cases using population density as a driver and doing a regional rather than national comparison. Going regional is fairly subjective: at what level is it fair to stop and why? Besides, policy effects should act nationwide and domestic travel and economic activity should make it rather easy to spread the virus once it enters a country. In addition to that, having good and comparable regional data is fairly complex, if possible at all.
Population Density
Did give a shot to analysing the effect of population density and here are the results
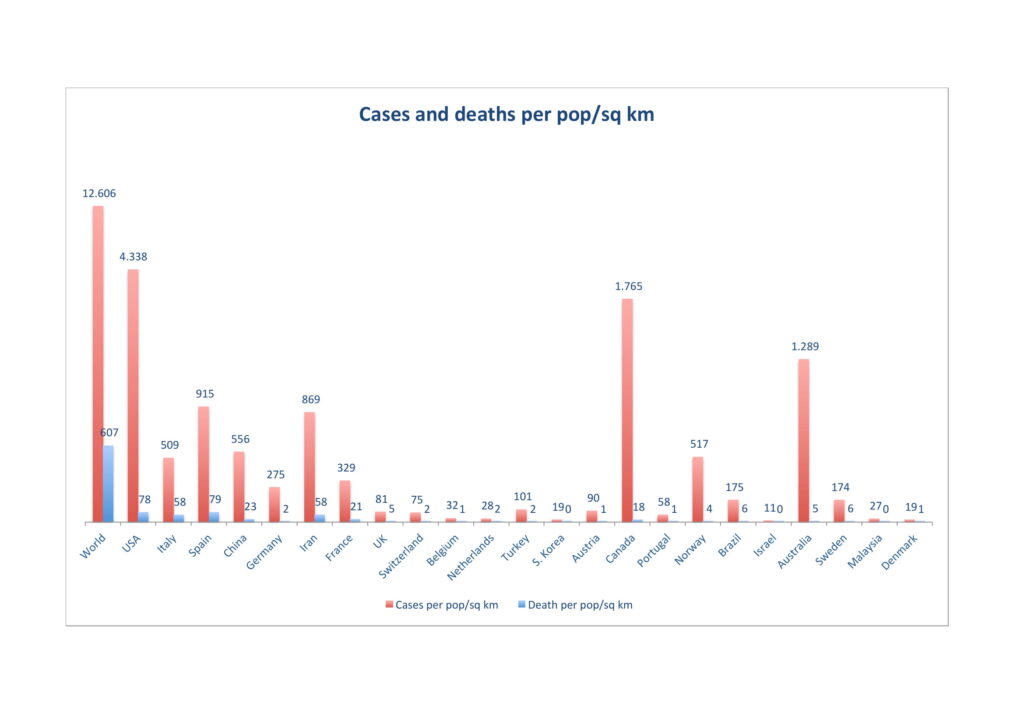
The idea behind those who suggested population density was to take into account the dynamics of interaction. In this view, more population per sq/km should imply more interactions. As a result, we see that density increases the relevance of sparsely populated countries, which should on the contrary have far less chance for virus diffusion. The picture that emerges is the one depicted above: US, Canada, Iran and Australia immediately stand out.
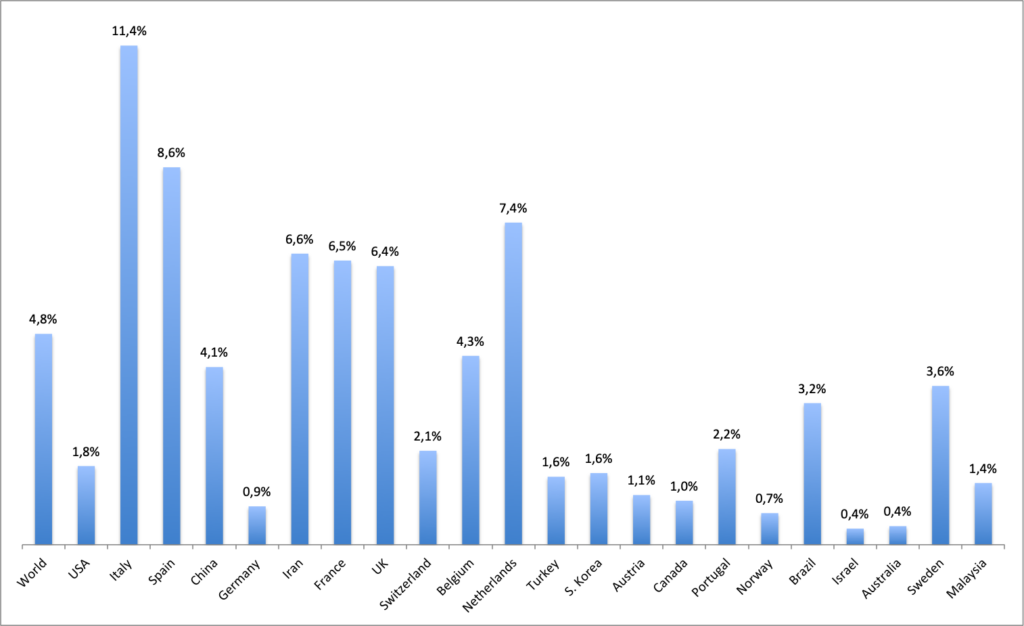
Mortality
Mortality defined as death over total cases shows a high level of variation in the worst affected countries. Mortality is affected by the numbers of cases detected so that effective mortality rates would probably be lower if all asymptomatic patients were accounted for. More thorough testing strategies and different response levels achieved by the national health systems could justify lower numbers in certain countries. Still a factor 10 difference between best and worst performers is quite hard to believe.
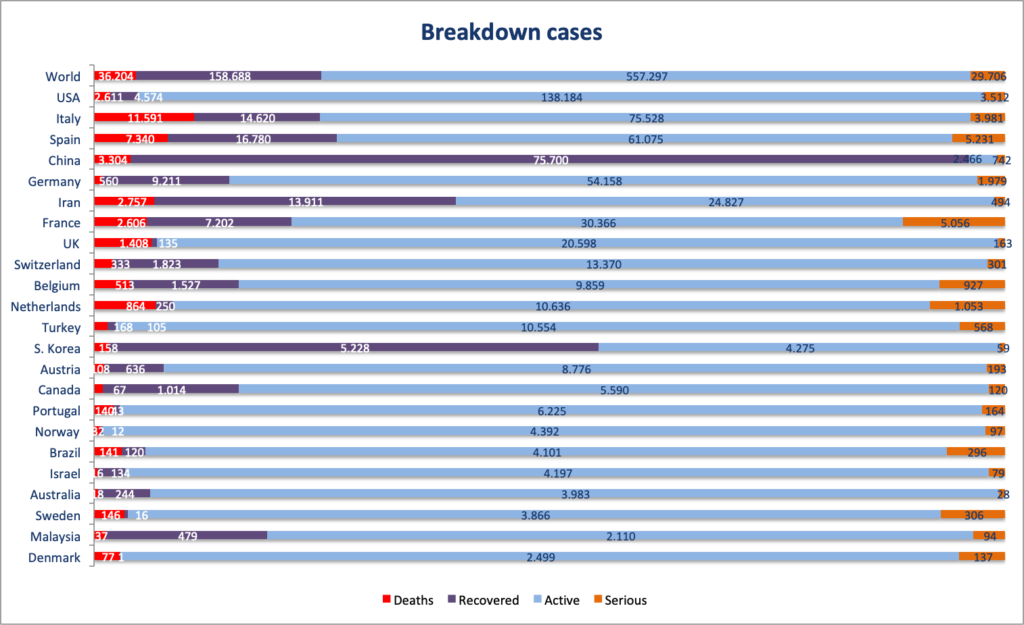
Cases Breakdown
Breakdown of cases highlights high maturity countries, meaning countries were recoveries – in purple – have surpassed active cases: South Korea, China, Iran. This evidence points to an east to west diffusion of the contagion. Also coming up strong in recoveries Italy, Spain, France and Malaysia showing earliest signs for confinement of the contagion.
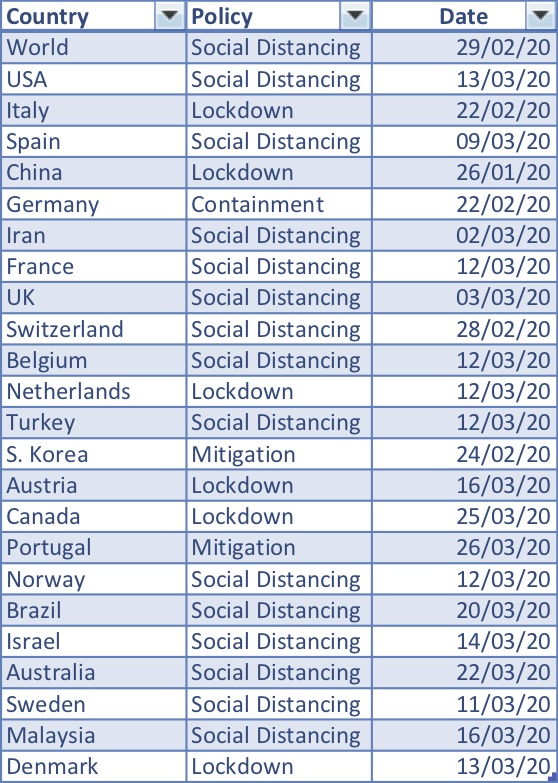
Government Actions
Government response has been wildly different. Besides the tough stance of China and – unfortunately – Italy, there are examples of much milder and yet effective approaches. The four policies can be considered in a progressive scale: Containment, Mitigation, Social Distancing and Lockdown.
Containment is acting early on locally to contain the spread of the virus: tracking the diffusion and isolating the vases identified.
Mitigation implies a more active stance in the lowering the spread of the virus that uses a mix of actions: travel bans, reduced public events, school and public office closures
Social Distancing is a rather vague but fashionable term that can be considered part of a wider mitigation policy. It involves all attempts at actively reducing opportunities for social interaction in communities. These include incentivising remote work, avoiding mass gatherings and restricting people’s ability to move.
Lockdown or quarantine finally is the heaviest social distancing measures, requiring people to stay at home and only get out for essential non-deferrable activities.
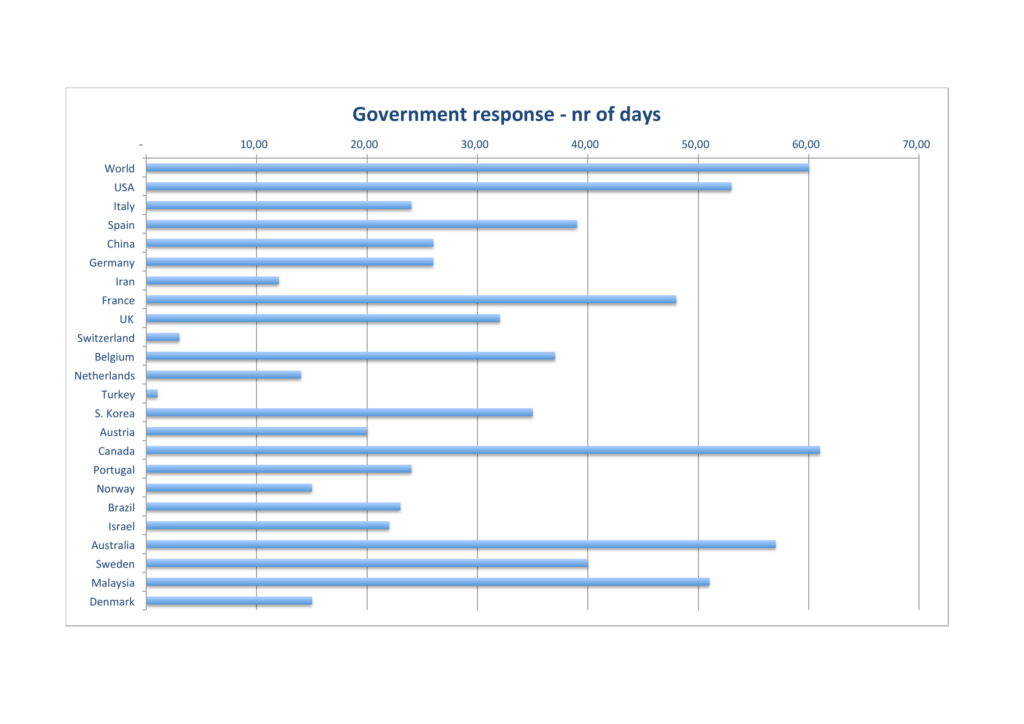
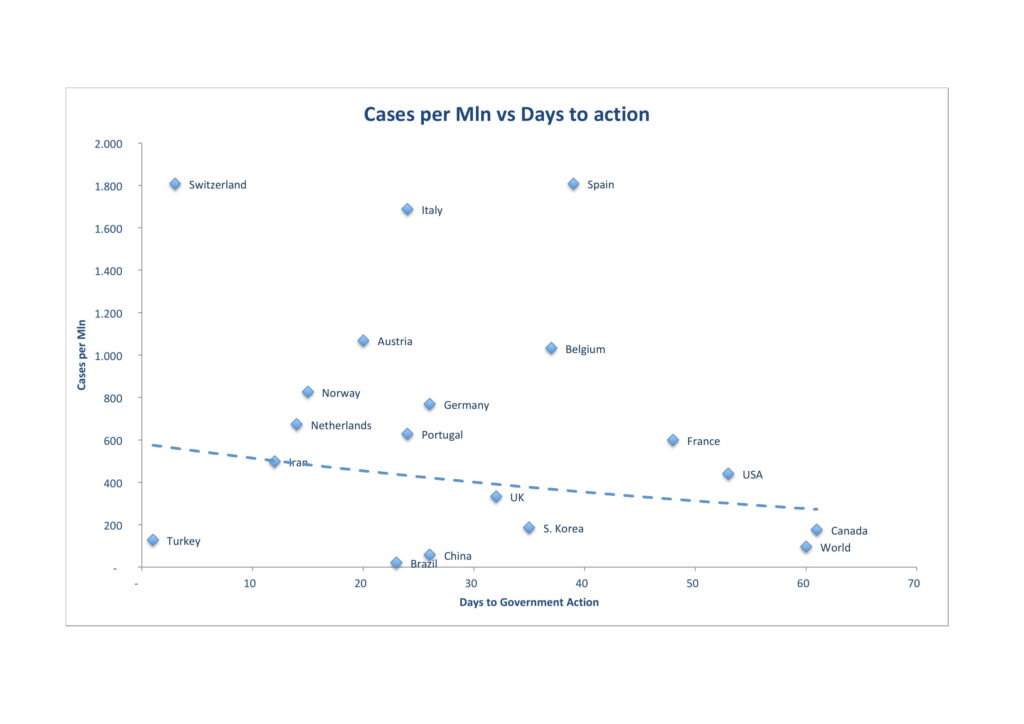
Speed of response
The speed of response is easier to assess. Most Governments have immediately posed limitations on travel right from the onset of the virus contagion. In the chart response is measured in days since the first case was reported in the country.
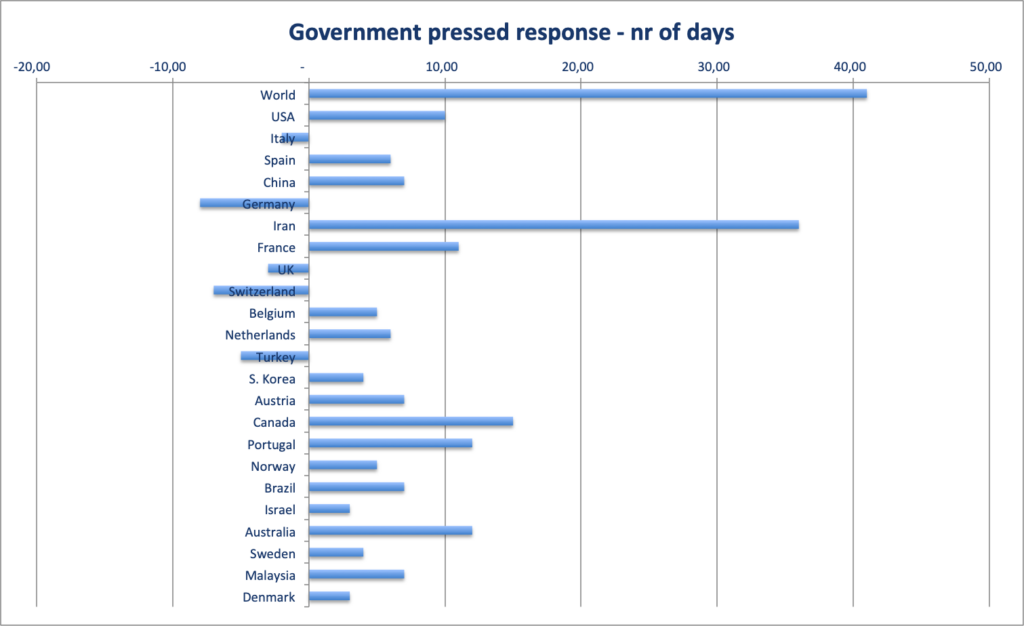
Governments pressed response
A more informative and possibly analytically relevant measure for coronavirus policy response is what I defined “Government pressed response“, the time between the emergence the the 100th case and Governments lead policy response. A few countries have actually acted proactively to the 100th case reported date, but this has not necessarily yielded the desired outcome (Italy, Turkey and Switzerland, for instance).
Government effectiveness
Using the model developed to simulate virus world diffusion and the number of days elapsed since the emergence of the first case in the country, an expected value for number of cases in each country was obtained. Government effectiveness has been evaluated as the ratio between cases observed vs case expected. A ratio below 100% should thus point to an effective government.
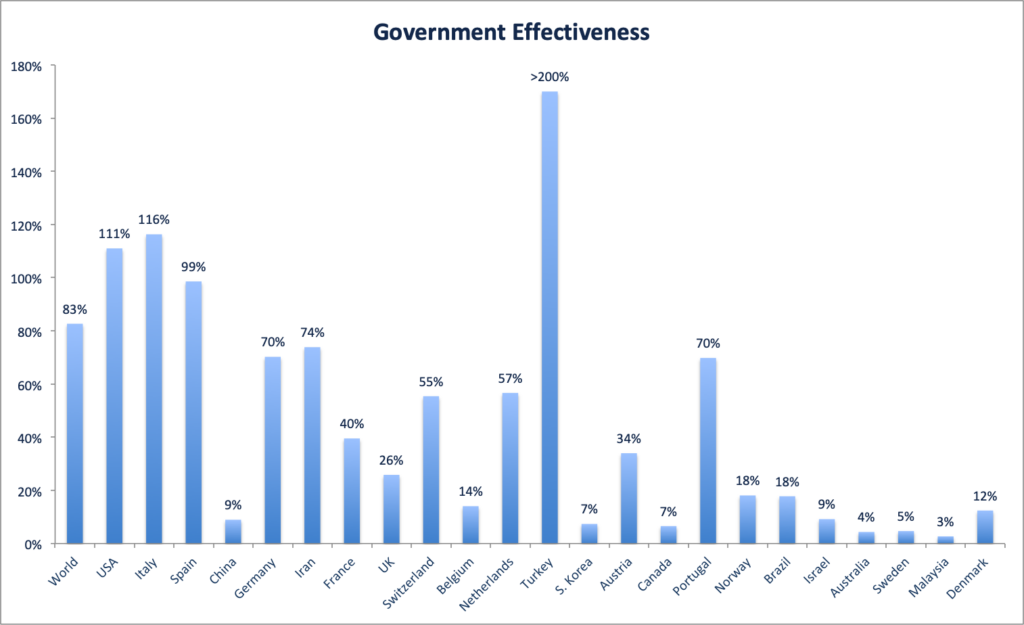
In this case, a high bar actually implies lower effectiveness in coronavirus policy response. Countries that have been containing the virus effectively are those with the shortest bars: China, Korea, Israel and Denmark among the others. As usual a short bar can also imply just an earlier stage of diffusion.
Government Response
Another hypothesis to test was speed of response vs virus diffusion. It shoes a bell shaped distribution around average days necessary to issue a policy response. As it is inconclusive, we can take a look at Government pressed response.
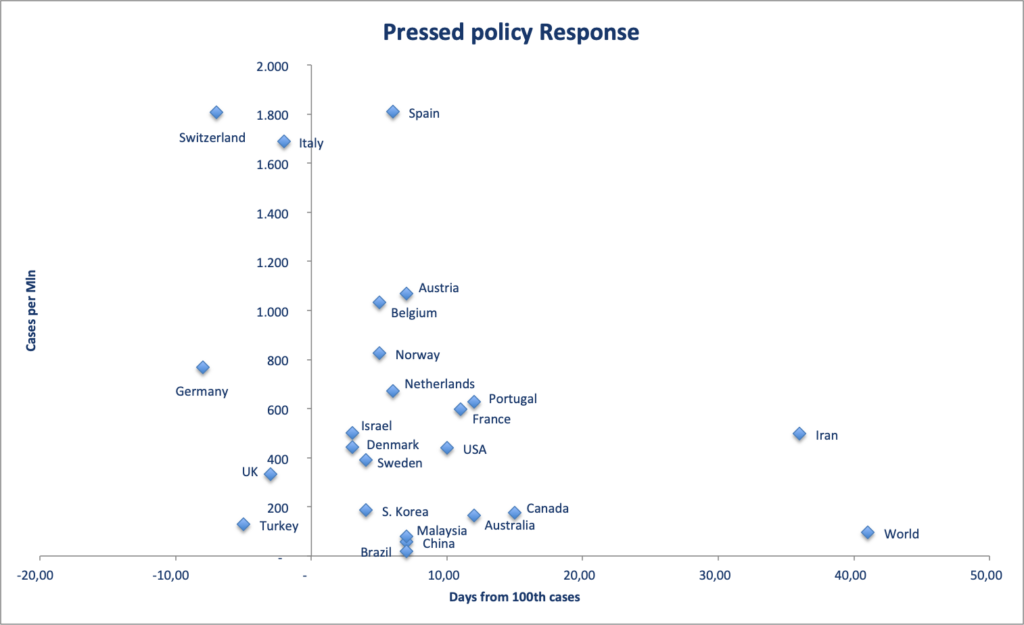
Pressed response – the number of days elapsed since reaching 100th case to policy action – is even more extreme. Countries have tended to react within 5-15 days since reaching their 100th case, but effectiveness of response does not show a clear dividend. A key parameter to consider in this analysis is policy choice (containment, mitigation, distancing, lockdown). Possibly left for further analysis.
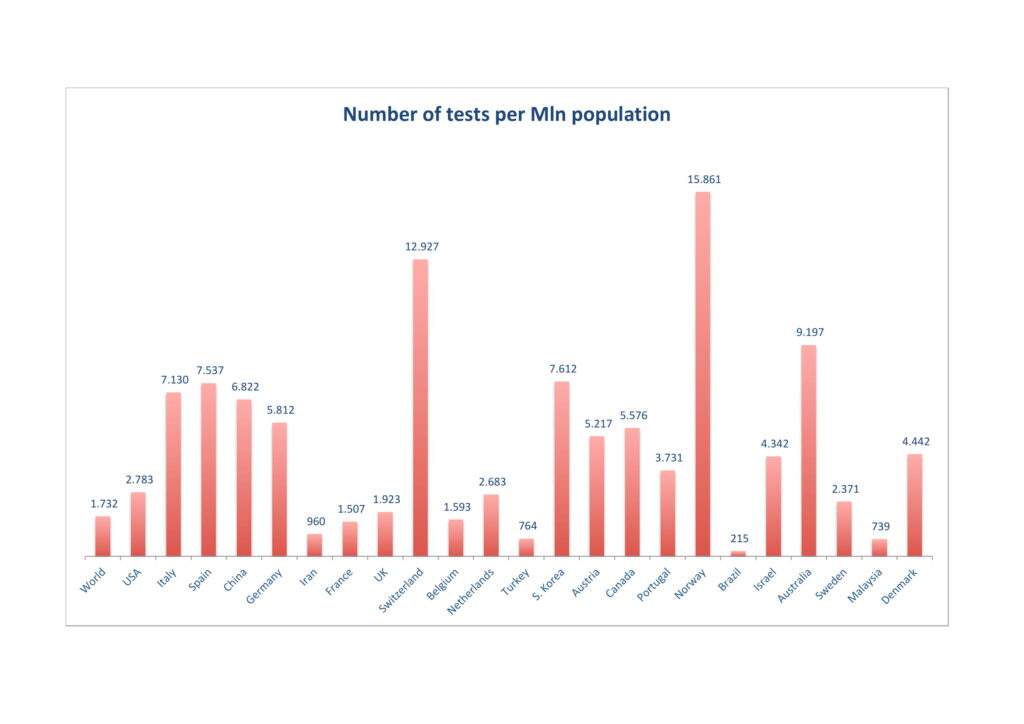
Testing
Testing is one of the actions that have proved most successful so far in containment strategies. Let’s thus take a look at which countries have tested the most per mln population. The outliers in this case are Switzerland, Norway and Australia, that are experiencing mixed results in terms of containment policy effectiveness. At this stage is nonetheless already clear that an extensive testing policy is a prerequisite of most winning strategies.
Testing effectiveness
Another way to asses the efficiency of testing is to relate it to the effectiveness of the containment strategy. We can read in the chart a dividend in testing: countries that test a lot tend to reduce the spread of the virus.
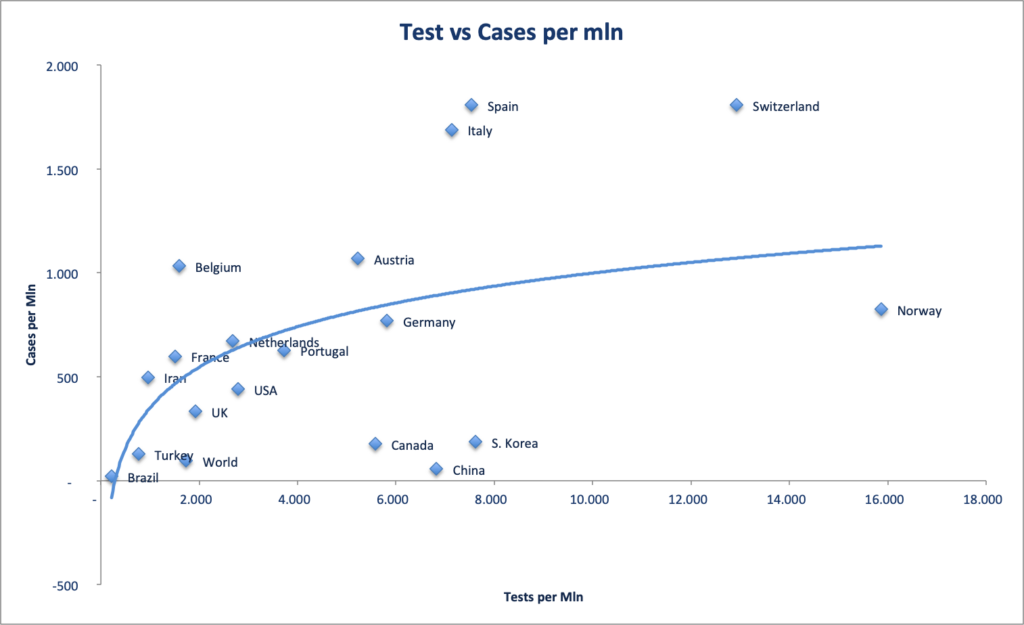
As both testing and virus diffusion (cases per Mln) depend on the maturity of the phenomenon in each country – number of days since its earliest diffusion – we can see that for any level of testing we obtain different levels of diffusion. Testing is thus just one element of an effective policy, but not the only one. On the other hand high testing countries tend to taper off in terms of maximum virus diffusion.
Conclusion
Even though the coronavirus epidemic is still under development, we can already infer some insights from government policies adopted by the worst affected countries.
- Responses have been very varied: there does not seem to be shared agreement on how to act in this type of emergencies
- Countries have responded with very different timings to the spreading of the virus within their country. The perception of the emergency has been very different, and even in recently hit countries
- High variation in mortality rates in different countries is still largely unexplained. Some analyst relate it to the severity of overwhelming of the health system in the country and in particular to ER under-capacity to fight off the respiratory syndrome
- Testing is a strong element of containment strategy in countries that have been most successful at curbing the virus
- A few countries have successfully managed to contain virus diffusion to a much a lower level than average, using world diffusion curve as a baseline at the equivalent time since the detection of the virus